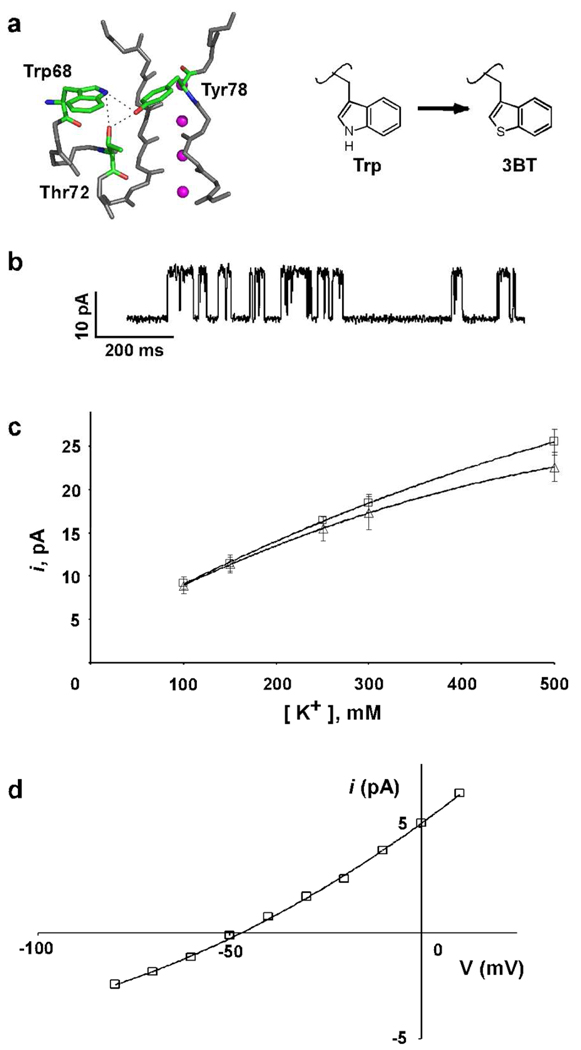
Fig. 5. The KcsA(Trp68→3BT) channel.
a) Close-up view of the selectivity filter. The peptide backbone of residues 68–80 and the side chains of residues Trp68 and Thr72 from one subunit and Tyr78 from an adjacent channel subunit that are involved in a H-bond network are shown in stick representation (pdb code: 1k4c). K+ ions are shown as magenta spheres. b) Representative single channel traces of the KcsA(Trp68→3BT) channels recorded at +150 mV in 10 mM succinate/150 mM KCl (pH 4.0) inside and 10 mM HEPES/150 mM KCl (pH 7.5) outside. c) Single channel current at +150 mV as a function of the K+ ion concentration for KcsA(Trp68→3BT) (Δ) and wild-type KcsA(□). Solid lines have no theoretical meaning. d) Macroscopic currents recorded using 10 mM succinate and 150 mM KCl (pH 4.0) as the internal solution, and 10 mM HEPES, 20 mM KCl, and 130 mM NaCl (pH 7.5) as the external solution are plotted against the voltage applied to determine the reversal potential (calculated reversal potential = −51 mV, measured = −48.3±2.2 mV).

