
Figure 12.
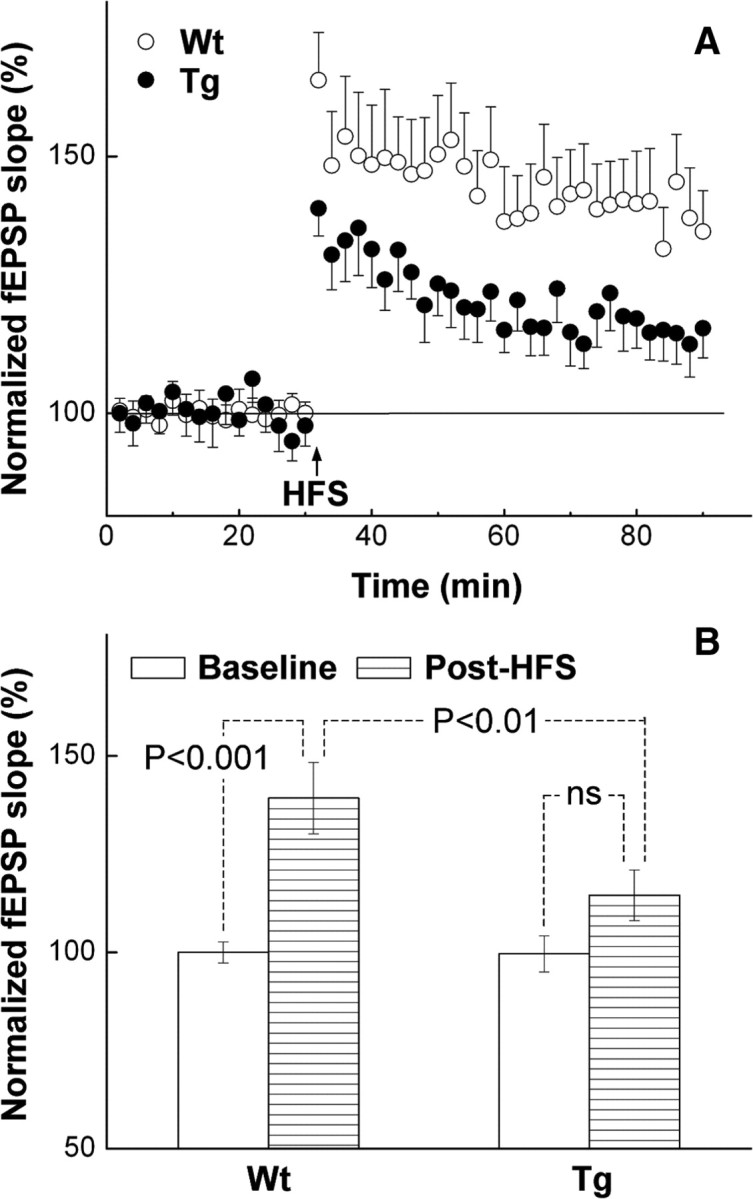
LTP in hippocampal CA1 region of wt and Tg mice. Averaged traces of normalized (relative to baseline) fEPSP slopes (A) and statistical analyses of data (B) are shown. A, HFS (0.05 ms impulse duration; 100 impulses; 100 Hz) is indicated by a vertical arrow. B, Baseline data are from 10-min-long background recordings obtained immediately before HFS, and the post-HFS data are from recordings obtained between 50 and 60 min after HFS. In both panels, data are shown as means ± SEM. The number of recordings from three pairs of mice is shown in Results. Statistical analysis in B was conducted using ANOVA with post hoc Tukey.