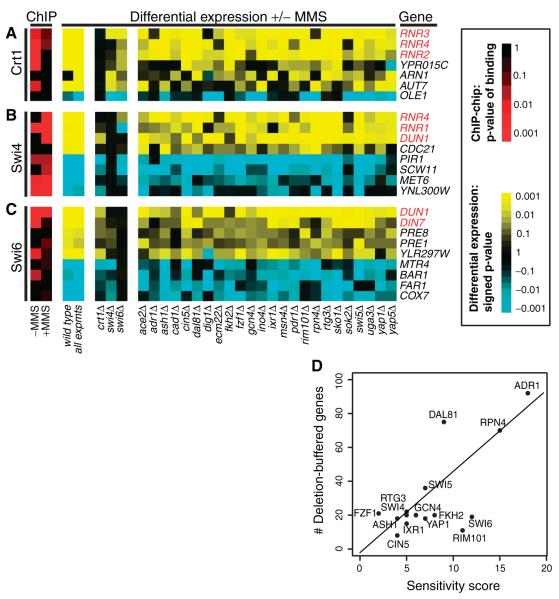
Fig. 4.
Representative genes showing deletion buffering for (A) Crt1, (B) Swi4, or (C) Swi6. Expression changes are colored yellow for up-regulation or blue for down-regulation. Genes highlighted in red are those previously known to function in the DNA damage response. (D) Correlation between phenotypic sensitivity of each deletion strain in MMS (x axis) versus the number of genes buffered by the TF deletion (y axis). Sensitivity scores were drawn from (6). Scores range from 0 to 30, where high scores indicate that a TF deletion was found to be sensitive to low concentrations (less than 0.03%) of MMS over replicate growth experiments. Only TFs with detectable sensitivity (score > 0) are shown.

