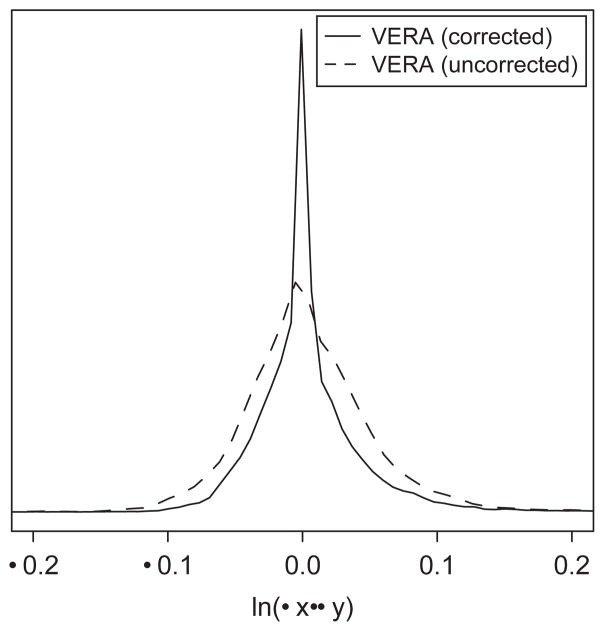
Fig. 4.
Application of dye-bias correction reduces variance in a control experiment. The solid curve represents the probability distribution of log ratio values determined following application of the corrected VERA method to control data. Conversely, application of the uncorrected VERA approach to the same data results in a distribution of log ratio values with larger variance (dashed line).

