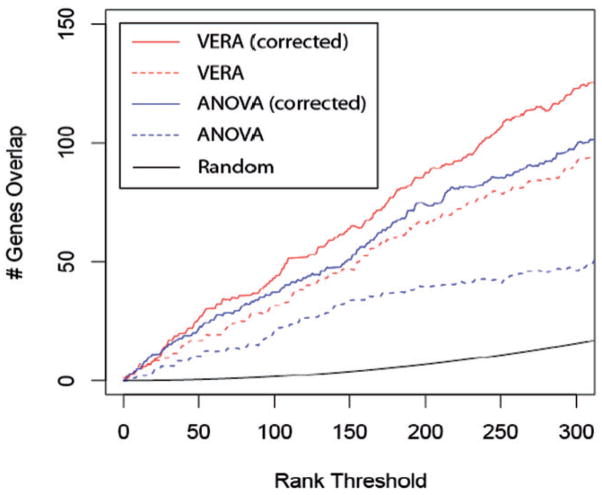
Fig. 5.
The dCTP- versus dUTP-labeled expression data is compared for different analysis methods. Since the true number of differentially expressed genes is unknown, the calculation is performed over a range of values (x axis). The y axis shows the number of genes assumed to be significant in both labeling approaches after correcting for any bias in the method (see Section 2.7).

