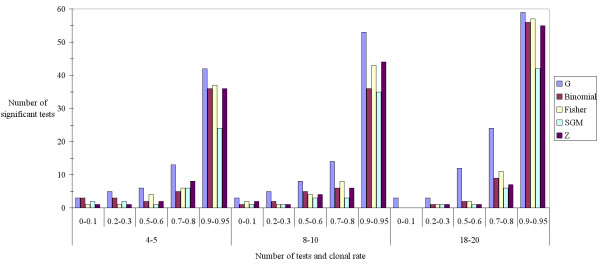
Figure 1.
Number of significant linkage disequilibrium tests (α = 0.05) as a function of increasing number of tests combined and increasing global linkage across all loci (clonal rate increase): for the most accurate test (G) and different combining procedures (Fisher, Binomial, SGM and Z as defined in the text). The number of tests was 60 for each bar (30 replicates × 2 modalities for each clonal rate and number of tests) (see text for more details on simulations).

