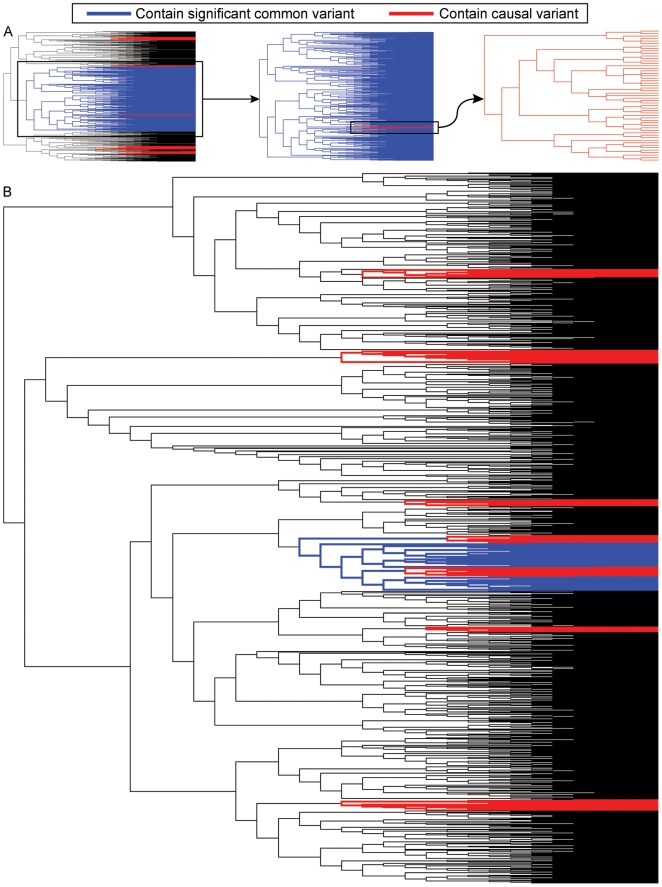
Figure 1. Example genealogies showing causal variants and the strongest association for a common variant.
(A) A genealogy with 10,000 original haplotypes was generated with 3,000 cases and 3,000 controls, genotype relative risk (γ) = 4, and nine causal variants. The branches containing the strongest synthetic association are indicated in blue. The branches containing the rare causal variants are in red. (B) A second genealogy was generated using the same parameters. These genealogies demonstrate two scenarios with genome-wide significant synthetic associations: the first (upper genealogy) had a high risk allele frequency (RAF = 0.49), and the second (lower genealogy) had a low RAF (0.08).

