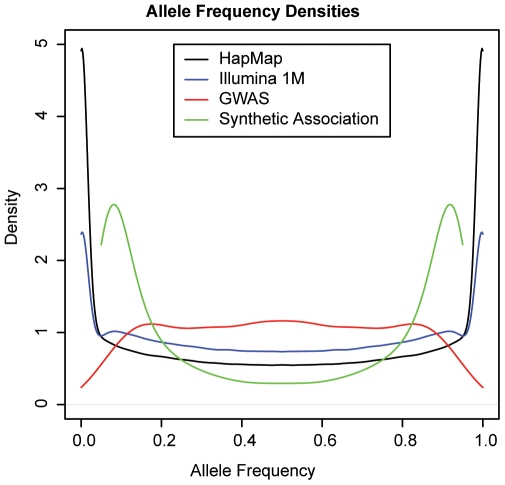
Figure 5. Allele frequency distributions of all HapMap SNPs (black), Illumina 1M SNPs (blue), and GWAS associations in CEU (red), and simulated synthetic associations (green).
The allele frequencies show both minor and major allele frequencies. GWAS associations have a clear tendency towards the center, representing greater power to detect association with variants with higher minor allele frequencies. CEU = population of western European ancestry.

