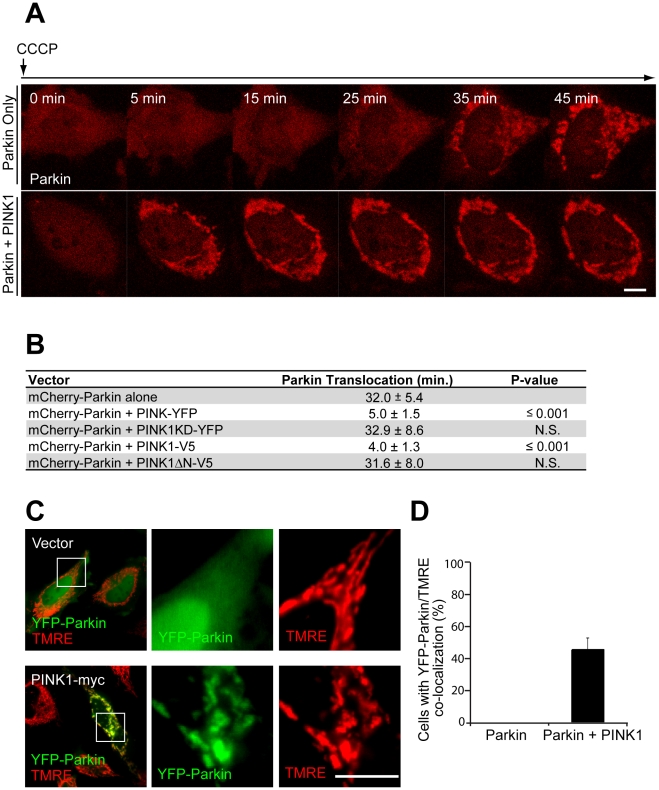
Figure 5. Kinetics of Parkin recruitment are modulated by PINK1 expression.
(A) HeLa cells transfected with mCherry-Parkin (red) alone or mCherry-Parkin (red) and PINK1-YFP in a 1∶1 ratio were imaged live following the addition of 10 µM CCCP in serum at time point 0 min. (B) HeLa cells transfected with mCherry-Parkin and the indicated construct in a 1∶1 ratio were treated as in (A) and imaged live (one frame/minute) following the addition of CCCP. Time to the beginning of Parkin translocation was defined as the first appearance of puncta in two or more quadrants of the cell for two or more consecutive images for six or more cells in a minimum of three independent experiments. N.S., nonsignificant. (C) Live confocal image of HeLa cells transfected with YFP-Parkin (green) or YFP-Parkin (green) and PINK1-myc (in a 1∶4 ratio). Cells were loaded with TMRE (red) to stain polarized mitochondria. Cells were not treated with CCCP. Scale bar in last image represents 10 µm. Images in the middle and right-hand panels are expansions of the boxed regions in the panels on the left. (D) Cells treated as described in (C) were scored for colocalization between YFP-Parkin and TMRE. ≥50 cells/experiment were scored in three or more independent experiments.

