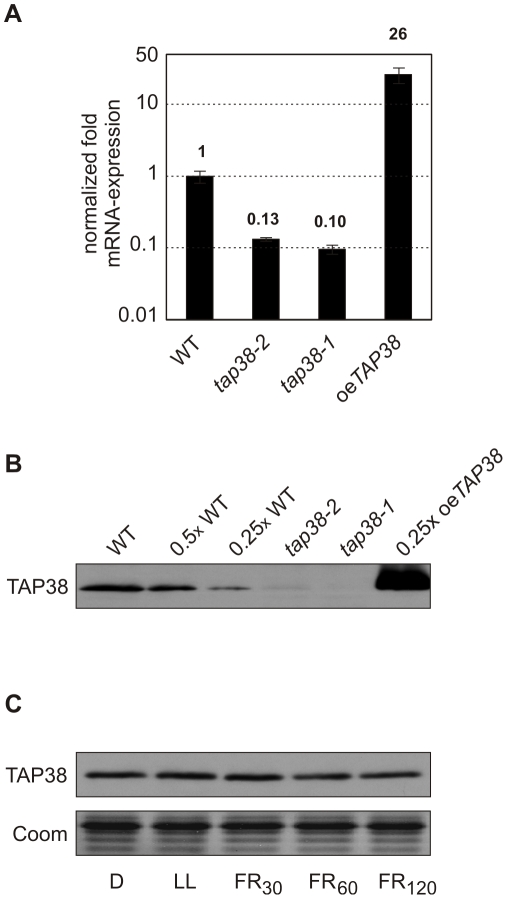
Figure 3. Expression of TAP38 in tap38 mutant, TAP38 overexpressor, and WT plants.
(A) Quantification of TAP38 mRNAs by real-time PCR in WT, tap38-1, tap38-2, and oeTAP38 leaves using the primer combination 1 and 2 (as in Figure S1A and S1B). (B) Thylakoid proteins from WT and tap38 mutants were loaded in the corresponding lanes. Reduced amounts of oeTAP38 thylakoids, corresponding to 25% of WT amount were loaded in the lane marked as 0.25× oeTAP38. Additionally, decreasing levels of WT thylakoids were loaded in the lanes indicated as 0.5× WT and 0.25× WT. Filters were immunolabeled with a TAP38-specific antibody raised against the mature TAP38 protein. (C) Thylakoid membranes of WT plants exposed to different light conditions (see Figure 5) were separated by SDS-PAGE. Immunodecoration of the corresponding Western blot was performed using a TAP38-specific antibody raised against the mature protein. A detail of a replicate gel, corresponding to the LHCII migration region, stained with Coomassie Blue is shown as loading control.

