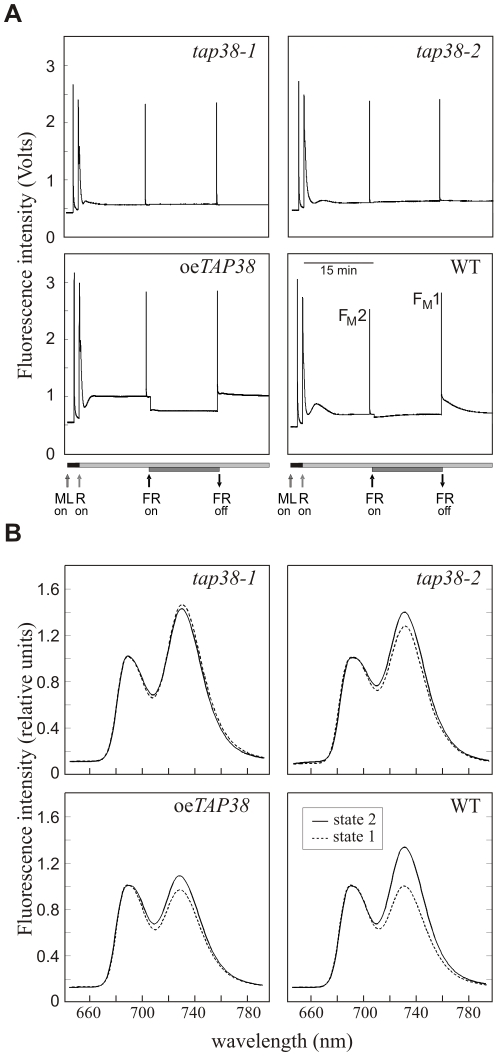
Figure 4. TAP38 is required for state transitions.
(A) Red light (R) and red light supplemented with far-red (FR) light were used to induce transitions to state 2 and state 1, respectively. FM1 and FM2 represent maximal chlorophyll fluorescence levels in states 1 and 2, respectively. Horizontal bars indicate the length of illumination. Arrows point to the moment when the specific light is switched on/off. Traces are the average of 10 replicates. ML, measuring light. (B) Low-temperature (77 K) fluorescence emission spectra of thylakoids were recorded after exposure of plants to light inducing either state 1 (dashed lines, far-red light of 740 nm) or state 2 (solid lines, low light; 80 µmol m−2 s−1) (see also Materials and Methods). The excitation wavelength was 475 nm, and spectra were normalized with reference to peak height at 685 nm. Traces are the average of 10 replicates.

