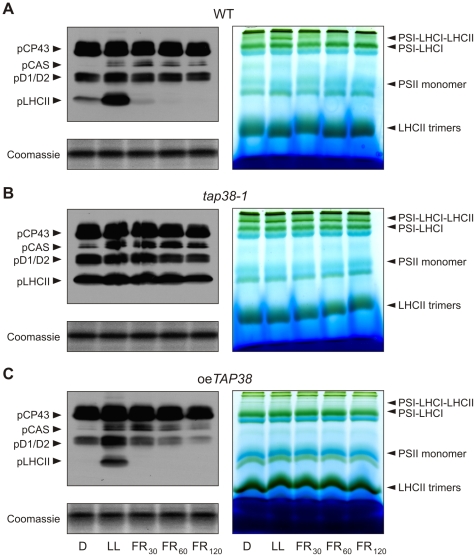
Figure 5. Levels of LHCII phosphorylation correlate inversely with TAP38 concentrations.
Left panel, thylakoid proteins extracted from WT (A), tap38-1 (B), and oeTAP38 (C) plants kept in the dark (D; state 1), subsequently exposed to low light (LL; state 2), and then to far-red light for 30, 60, and 120 min (FR30, FR60, FR120; state 1) were fractionated by SDS-PAGE. Phosphorylation of LHCII and PSII core proteins was detected by immunoblot analysis with a phosphothreonine-specific antibody. One out of three immunoblots for each genotype is shown. pCAS, phosphorylated CAS [44]; pCP43, phosphorylated CP43; pD1/D2, phosphorylated PSII-D1/D2; pLHCII, phosphorylated LHCII; Coomassie, portion of Coomassie-stained PA gels, identical to the ones blotted and corresponding to the LHCII migration region, were used as loading control. Right panel, thylakoid proteins of WT (A), tap38-1 (B), and oeTAP38 (C) plants treated as in the left panel were subjected to BN-PAGE analysis. Accumulation of the state 2-associated 670-kDa protein complex [14] correlates with the phosphorylation level of LHCII. Note that tap38-2 behaved very similarly to tap38-1 (data not shown). One out of three BN-PAGEs for each genotype is shown.

