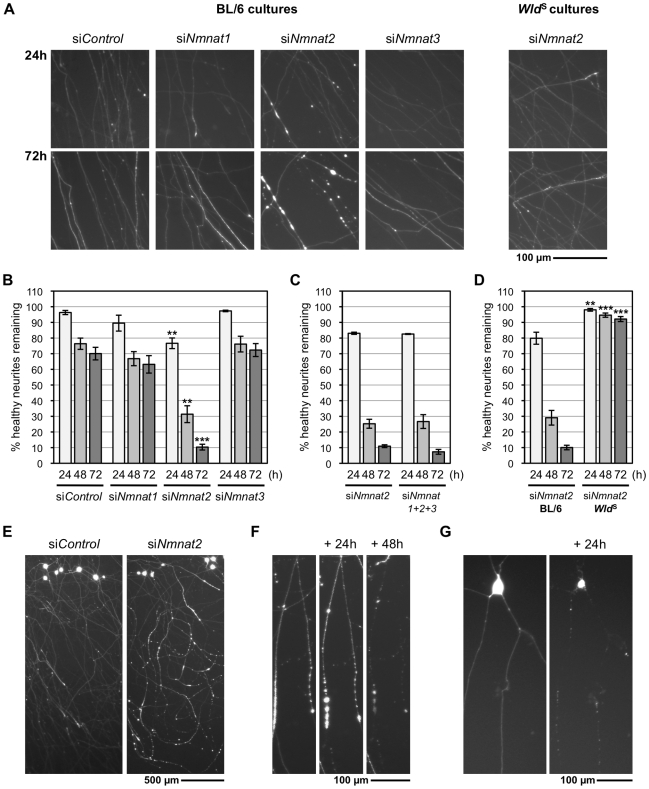
Figure 4. Nmnat2 siRNA triggers Wallerian-like degeneration of SCG neurites.
(A) Representative fluorescent images of the distal ends of (DsRed2-labeled) neurites of wild-type (BL/6) or Wld S SCG neurons 24 and 72 h after injection with non-targeting siRNA (siControl) or siRNA targeting each Nmnat isoform (siNmnat1, 2, or 3), as indicated, together with pDsRed2-N1 (50 ng/µl) (see also Figure S4). (B) Relative survival of (DsRed2-labeled) neurites of wild-type SCG neurons injected with siControl, siNmnat1, siNmnat2, or siNmnat3. The number of healthy DsRed2-labeled neurites remaining at each time point is shown as a percentage of the total number (both healthy and abnormal) 24 h after injection and was quantified from three independent experiments combining data from multiple fields (error bars = ±S.E.M.). Only siNmnat2 causes significant neurite loss (**p<0.01, ***p<0.001, t test siNmnat2 versus siControl at equivalent time points). (C) Co-injection of siNmnat1, 2, and 3 (each at 100 ng/µl) does not accelerate (wild-type) neurite loss compared to injection of siNmnat2 alone (100 ng/µl). Data were quantified as in (B) from three independent experiments (error bars = ±S.E.M.). (D) Neurite loss caused by siNmnat2 injection is abolished in Wld S SCG neurons up to 72 h after injection (**p<0.01, ***p<0.001, t test Wld S versus BL/6 at equivalent time points). Data were quantified as in (B) from four independent experiments (error bars = ±S.E.M.). (E–G) Representative fluorescent images showing the typical characteristics of the neurite degeneration caused by siNmnat2 injection. Multiple DsRed2-positive neuritic swellings are only observed after siNmnat2 injection (E) and these precede a characteristic progressive distal-to-proximal “dying-back” neurite degeneration (F). Neurites showing “dying-back” degeneration can be followed back to morphologically normal cell bodies. This contrasts the more rapid, catastrophic neurite degeneration that coincides with cell body death (G) and is seen following injection of all siRNA pools (including siControl). Images in (E) were captured 48 h after injection and show injected cell bodies at the top of each panel.

