Figure 2.
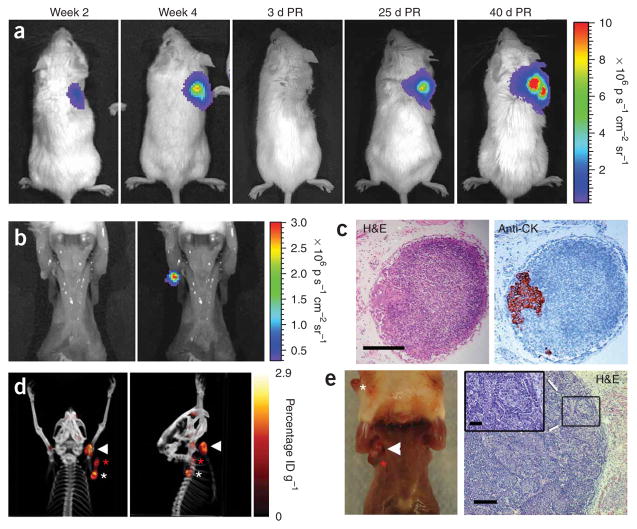
Monitoring lymph node metastasis in a prostate cancer xenograft model. (a) Representative images of a mouse with LAPC-9–VEGF-C–GFP–RL tumor cells grafted on the right shoulder to promote metastasis to brachial and axillary lymph nodes. The kinetics of tumor growth can be monitored by bioluminescence imaging of Renilla luciferase–expressing tumor cells. Color bar represents photons s−1 cm−2 steradian−1 (p s−1cm−2 sr−1); PR, post-resection.
(b) Bioluminescence (Renilla luciferase activity) in the exposed ipsilateral axillary lymph node of a mouse with a tumor 4 weeks after implantation. Left, photo; right, overlay. (c) Histological analysis of the photon-emitting lymph node in b shows a subcapsular microscopic lesion as visualized by staining with H&E (left) and with an antibody to human cytokeratin (anti-CK; right).
(d) PET-CT imaging with 18FLT at 30 d after resection of the primary tumor shows extensive metastasis (color bar represents percentage injected dose per gram, ID g−1). (e) Photograph (left) of this mouse shows extensive metastasis in the ipsilateral primary axillary (white arrowhead) and accessory axillary (red asterisk) lymph nodes. The primary tumor regrowth (white asterisk) is also present. H&E staining (right) shows extensive infiltration by tumor cells, distending the axillary lymph node. Higher magnification inset (inset) of boxed region shows that tumor cells make up most of the population. Scale bars, 200 μm (c,e right), 50 μm (e, right inset).

