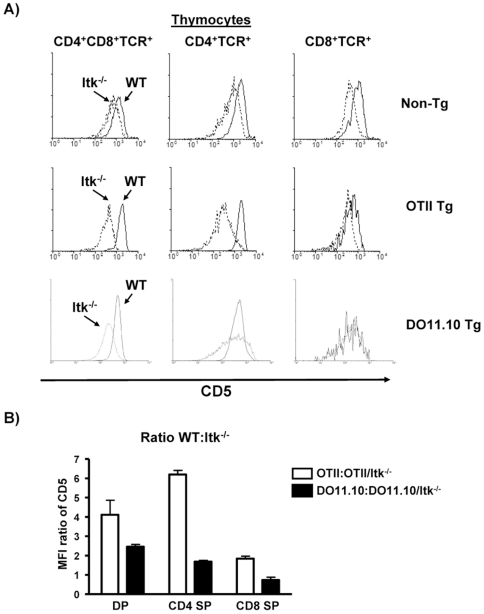
Figure 6. The strength of the TCR signal is reduced in the absence of Itk.
(A) Thymocytes from non-transgenic WT, Itk−/− mice, TCR transgenic OT-II and OT-II/Itk−/−, or TCR transgenic DO11.10 and DO11.10/Itk−/− mice were stained with CD4, CD8α, TCR (or transgenic TCR) and CD5. Histograms of CD5 expression on DP, transgenic TCRhiDP, transgenic TCRhiCD4SP and transgenic TCRhiCD8SP from WT (solid lines), Itk−/− (dashed lines) are shown. A minimum of 6 mice of each genotype with 6–12 weeks of age were analyzed, and representative flow profiles are shown. (B) The ratios of the mean fluorescence intensities (MFI) for CD5 for WT:Itk−/− TCR transgenic mice are indicated for double positive and CD4 and CD8 single positive thymocytes. *p<0.05, n = 3–5 mice.

