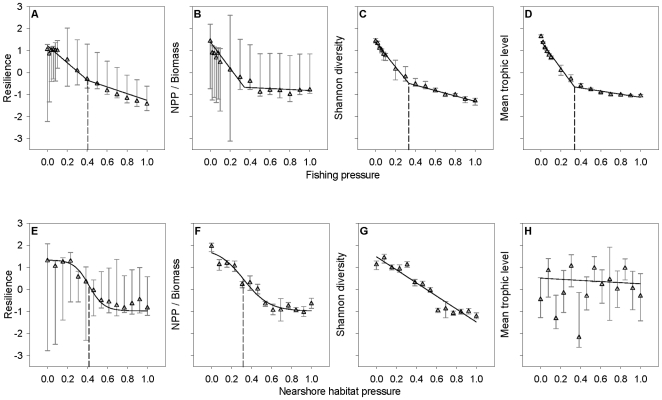
Figure 2. Model-generated relationships between 4 ecosystem attributes and increasing ecosystem-wide fishing (a-d) or nearshore habitat (e-h) pressure.
The ecosystem attributes are resilience, NPP/Biomass, Shannon diversity, and mean trophic level. Open triangles indicate median values calculated from Monte Carlo simulated Ecopath with Ecosim data (n = 100), and error bars denote 95% confidence intervals. The solid lines represent best-fit functional relationships and the dotted lines designate significant utility thresholds estimated using a nonparametric bootstrap resampling procedure (n = 10,000 for each Monte Carlo data set) (parameter values and significant utility thresholds listed in Table 2). NPP = net primary production. In this and following figures, the ecosystem attributes (y-axes) have been re-scaled so that larger values are considered unstressed rather than stressed. The pressure values have been re-scaled relative to the maximum simulated pressure, and are contained within the range [0, 1].

