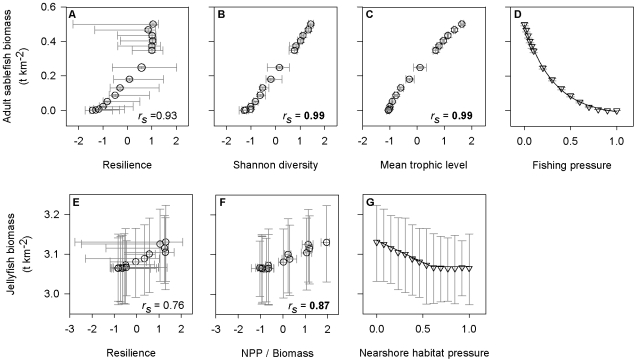
Figure 3. Correlations between indicators and attributes with significant utility thresholds, along with indicator-pressure relationships.
The indicators are sablefish and jellyfish biomass for the fishing (a-d) and nearshore habitat (e-g) pressure simulations, respectively. Open circles (a-c, e-f) and triangles (d, g) indicate median values calculated from Monte Carlo simulated Ecopath with Ecosim data (n = 100 for each pressure level), and error bars denote 95% confidence intervals. The solid lines in (d) and (g) represent best-fit functional relationships estimated using a nonparametric bootstrap resampling procedure (n = 10,000 for each Monte Carlo data set) (parameter values listed in Table 3). rs = median spearman rank correlation across the Monte Carlo data sets (bold indicates 95% CI did not overlap zero), NPP = net primary production.

