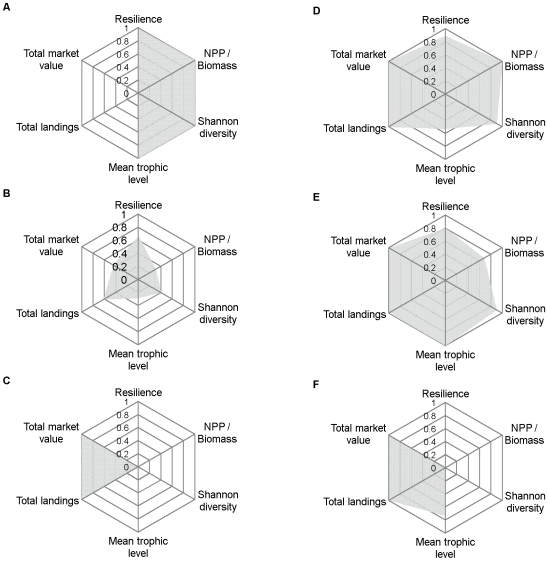
Figure 4. Spider plots depicting trade-offs among four ecosystem attributes and two fisheries yield metrics.
The three different fishing (a-c) and nearshore habitat (d-f) pressure levels corresponded approximately to a minimum-impact scenario in which none of the utility thresholds were breached (a, d), a threshold scenario in which the simulated pressure matched that of the lowest utility threshold (median value; see Table 2) (b, e), and a maximum-impact scenario representing the maximum pressure considered (c, f). Note that for each type of pressure, all attributes have been re-scaled so that values are relative and fall within the interval [0,1], where zero corresponds to a stressed condition and one corresponds to an unstressed condition.

