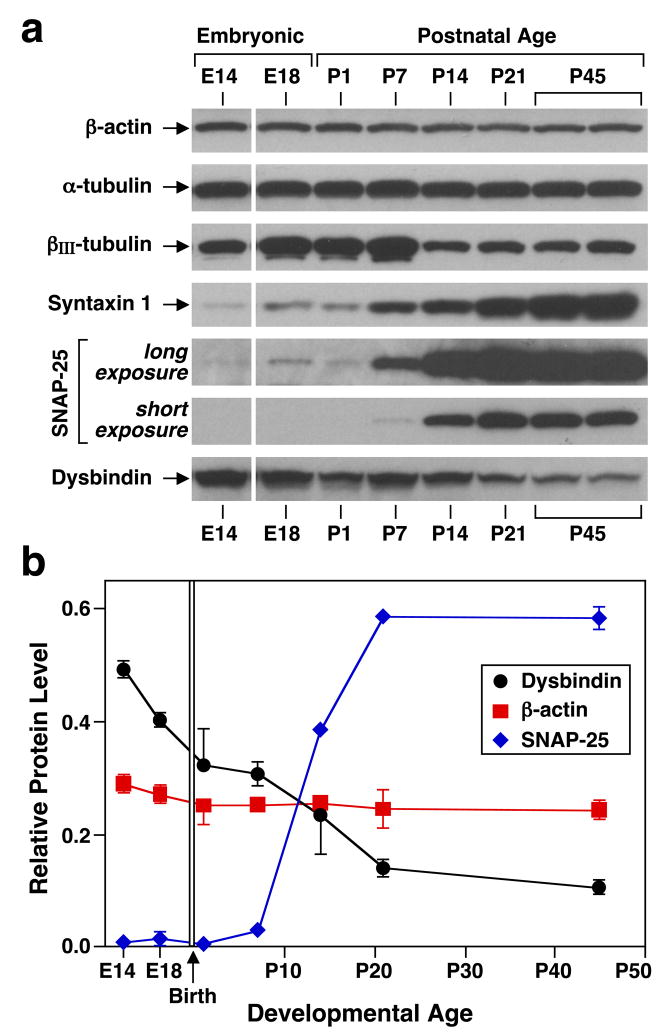
Figure 1.
Developmental regulation of dysbindin protein level in mouse cerebral cortex. (a) Immunoblotting analysis of “whole-tissue” detergent extracts (20 μg total protein) prepared from cerebral cortices dissected out of C57BL/6J mice at embryonic day (E)14 and E18 and postnatal day (P)1 through P45. (b) Quantitative analyses of the relative expression levels of selected proteins in cortex from mice at different developmental ages. Each value derived from densitometric analysis was corrected for background and divided by the sum of values obtained in the same immunoblot image for one sample each of P1, P7, P14 and P21. For the sake of clarity, data are represented as means ± s.e.m. (2–4 independent samples per age), even when all data points were analyzed together by linear regression to assess departure from a theoretical line with slope equal to zero (18 degrees of freedom; dysbindin, P < 0.001; β-actin, not significant).

