
Figure 6.
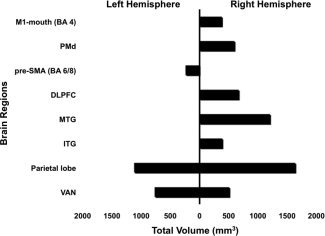
Volumes in mm3 of significant correlations (r‐value ≥ 0.5, z‐score ≥ 2.8, and P ≤ 0.0025) in various brain regions that correlated with loudness following LSVT LOUD in left and right hemispheres. M1‐mouth, primary motor cortex, mouth; PMd, dorsal premotor areas; SMA, supplementary motor area; DLPFC, dorsolateral prefrontal cortex; MTG, middle temporal gyrus; ITG, inferior temporal gyrus; VAN, ventral anterior nucleus.