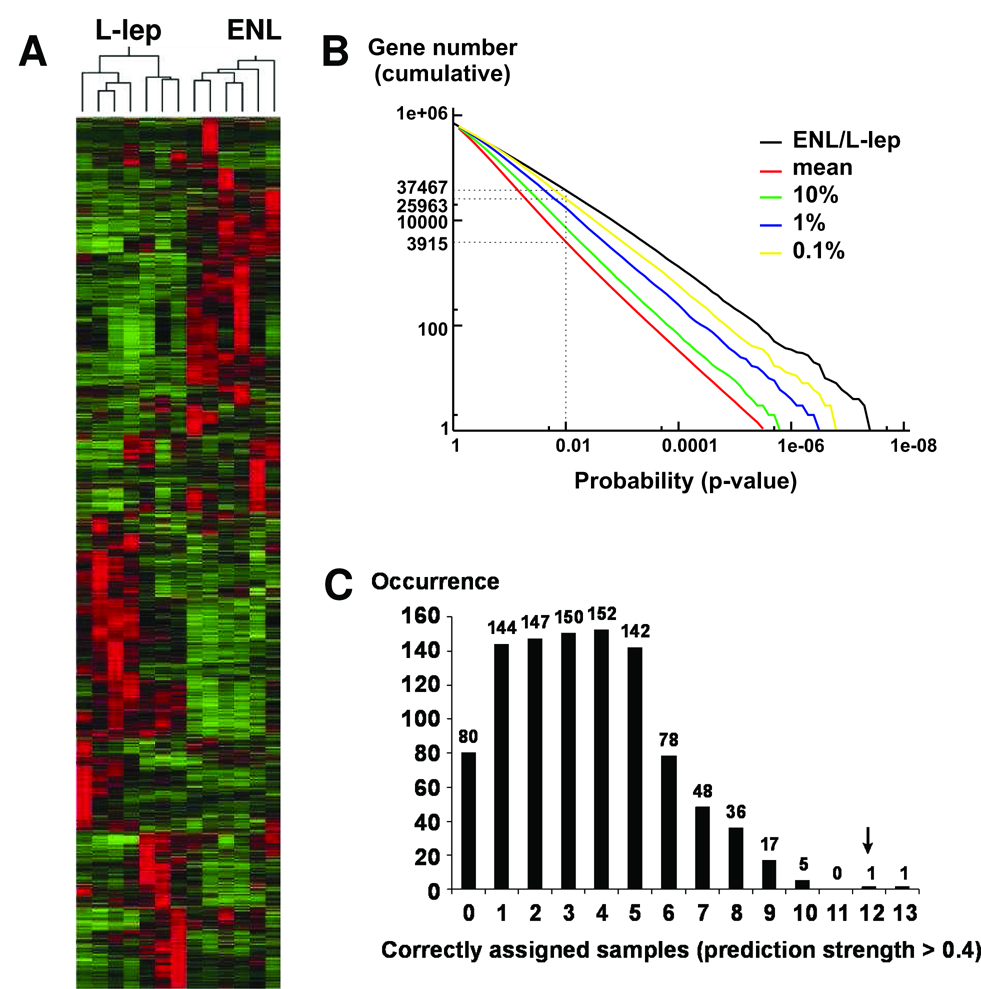
Figure 1.
(A) Unsupervised data analysis separates leprosy lesion samples into clinically relevant subclasses based on their gene expression patterns. Hierarchical clustering analysis divides 7 L-lep and 6 ENL skin lesion samples into two distinct groups that cluster on separate branches of a dendrogram. There are 3158 probe sets represented in this diagram. (B) Permutation analysis of the microarray data reveals that only less than 0.1% of the permutated groupings manifest more distinction in gene expression than the defined ENL / L-lep patient grouping. The cumulative numbers of probests (Y-axis) with Student’s t-test p-values less than various threshold levels (X-axis) were calculated for the clinically relevant ENL / L-lep grouping and plotted (black). One thousand randomly permutated groupings were also generated and tested. We plotted the mean (red), 10% (green), 1% (blue), and 0.1% (yellow) number of probesets below a given p-value among the permutated groupings and compared these to the correct ENL / L-lep grouping. Compared to the 0.1% confidence level, the ENL / L-lep grouping generally has more differentially expressed probesets with p-values below the indicated threshold, indicating that the ENL / L-lep grouping is statistically significant. (C) Prediction accuracy using leave-one-out cross-validation and weighted gene-voting. Using the ENL / L-lep grouping, our prediction algorithm correctly assigned the subclasses of 12 out of 13 samples with high confidence (prediction strength >0.4).

