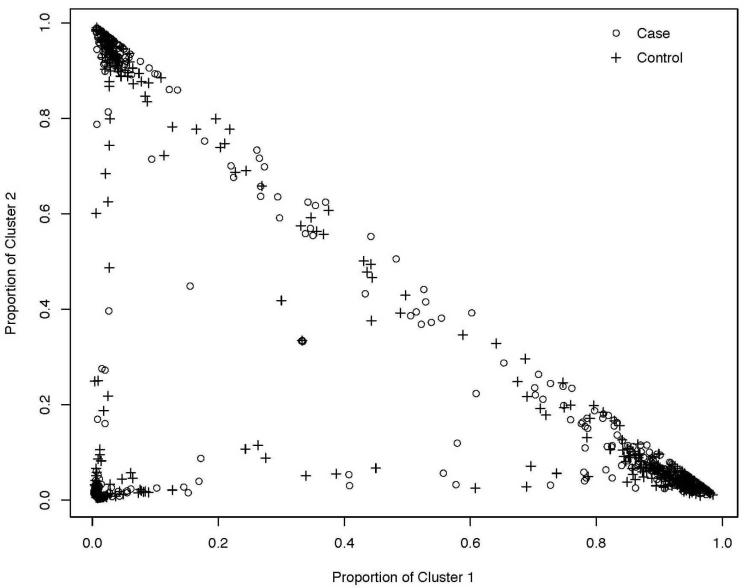
Figure 2.
Clustering results from STRUCTURE, with k=3 in the European American sample of cases and controls. The proportional membership in cluster 1 is plotted against the proportional membership in cluster 2. Each + represents the proportional membership for a control and the circle represents the proportional membership in the three clusters for each case.

