Fig. 4.

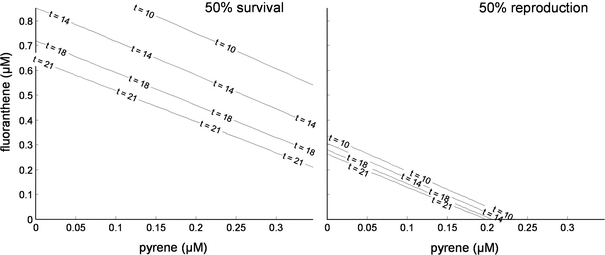
Iso-effect lines for survival and reproduction, interpolated based on the fit of Fig. 2. Lines represent the 50% effect level at varying time points

Iso-effect lines for survival and reproduction, interpolated based on the fit of Fig. 2. Lines represent the 50% effect level at varying time points