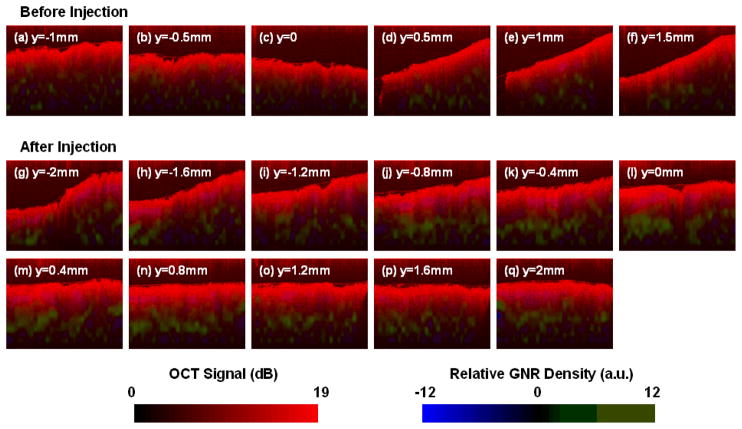
Fig. 5.
GNR contrast-enhanced SOCT images of a human breast carcinoma tissue sample. (a)–(f) Series of B-mode images before injection, sampled every 0.5 mm along y; (g)–(q) images after the second injection of GNR solution in Sample 2 (cf. Fig. 4), taken from the image stack every 0.4 mm along y. The structural OCT image is presented in red, and the SOCT-computed GNR density is presented in green (ρ>0) or blue (ρ<0). The tissue sample after GNR injection displays a strong and positive increase in ρ compared with the control. Image dimensions: 3 mm × 1 mm.

