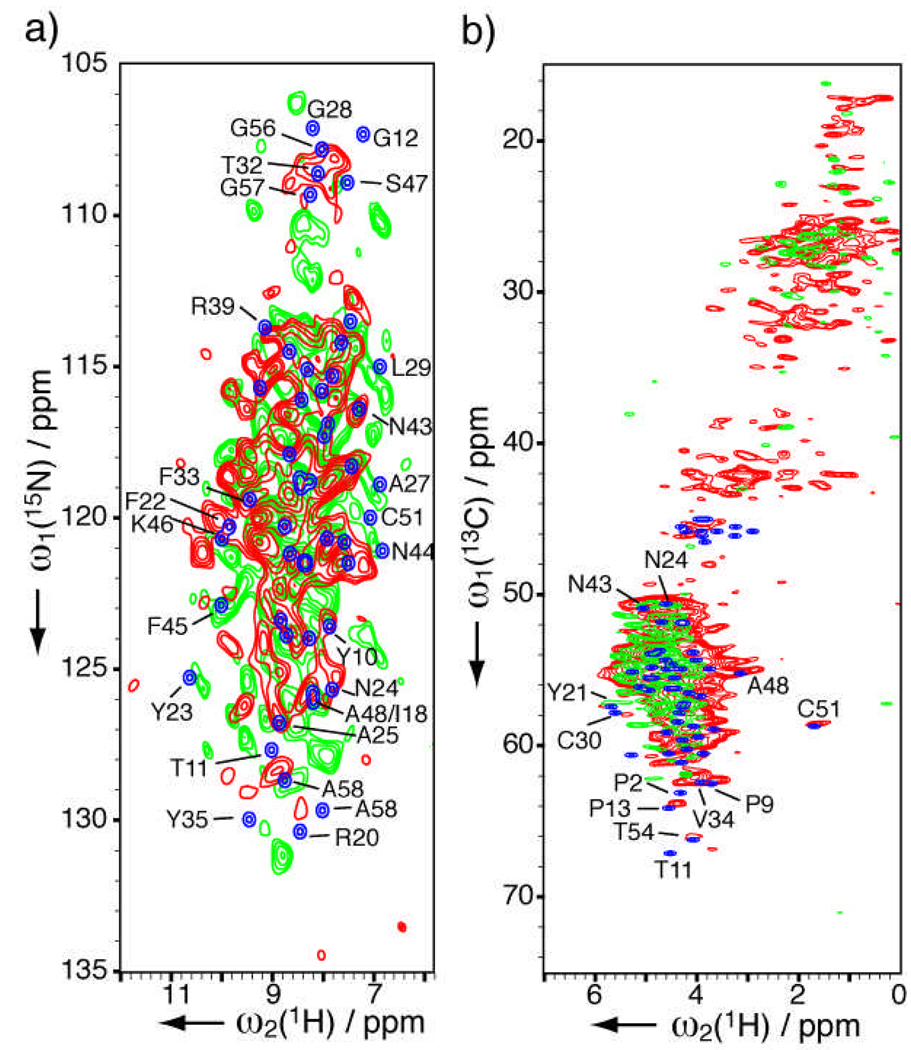
Figure 1.
Solid-state HETCOR NMR spectra of natural abundance lyophilized aprotinin sample A (7.2 mg, in red) and B (3.5 mg, in green) from different suppliers. Spectra in blue are simulated from solution chemical shifts (BMRB database #5359). (a) 15N-1H 2D spectra acquired in 26 (31) h with 640 (1024) scans per row, t1max(15N) = 10 (7.5) ms and linear-predicted to 20 (15) ms, t2max(1H) = 3.4 (3.4) ms for sample A (B). Lorentzian-to-Gaussian apodization was applied (150-to-300 Hz for 1H, 15-to-30 Hz for 15N) followed by sine bell apodization (54° shift) for each dimension. (b) 13C-1H 2D spectra acquired in 19 h with 48 scans per row for both samples. t1max(13C) = 11 ms and linear-predicted to 22 ms, t2max(1H) = 3.4 ms. Lorentzian-to-Gaussian apodization was applied (150-to-300 Hz 1H, 40-to-80 Hz for 13C) followed by sine bell apodization (54° shift) for each dimension. Contours are drawn starting at 6 times the noise level, with a spacing factor 1.15.

