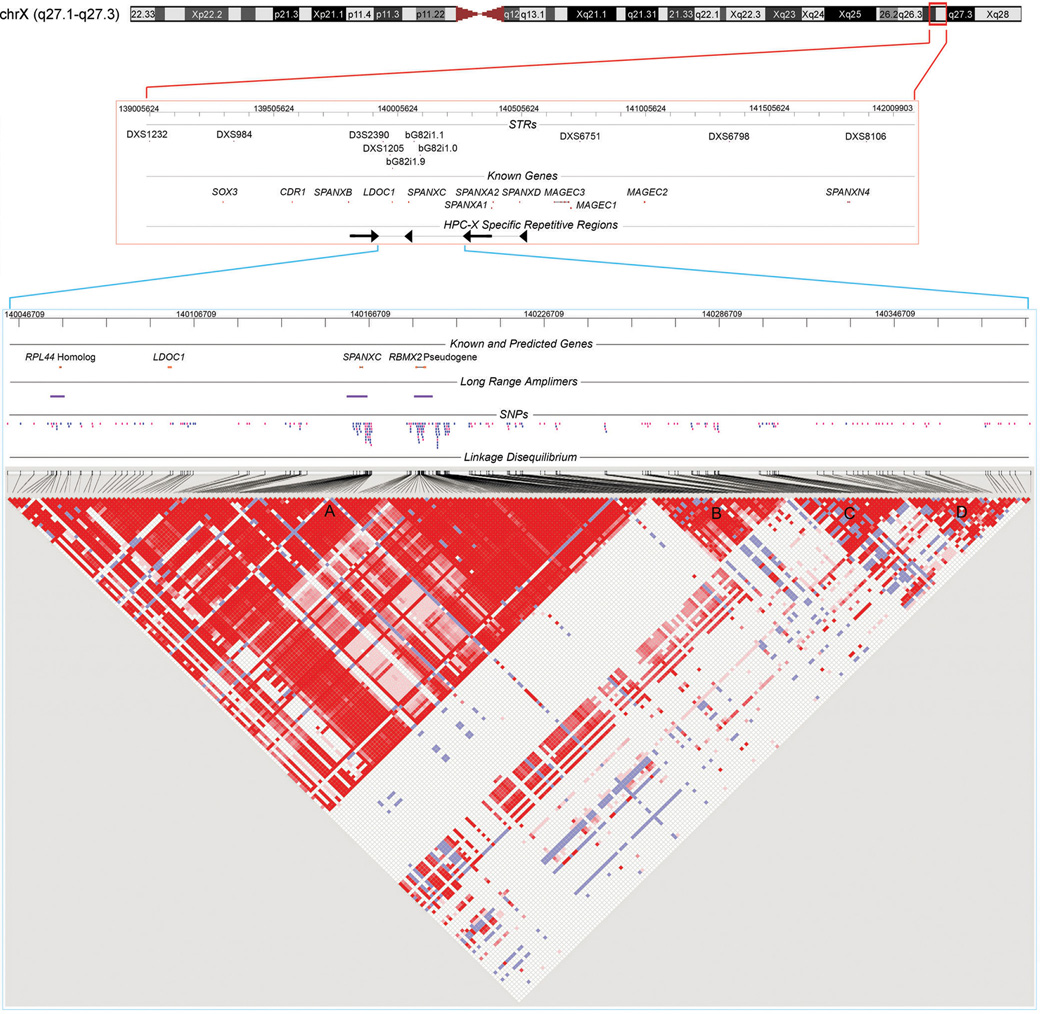
Fig. 1. HPCX Candidate Interval.
3 MB of Xq27.1-27.3 depicting previously genotyped STR markers, annotated genes, and a complex HPCX specific repeat is shown at top (red bounding box, NCBI build 36.1 ChrX: 139005624-142009903 bp). The candidate interval for study is zoomed at bottom (blue bounding box, ChrX:140046709-140391709 bp). The interval contains SPANXC and LDOC1, as well as a predicted RPL44 homolog and a pseudogene of RBMX2. As members of larger gene families, unique long range amplimers (denoted) were required to ensure site-specific assays. Polymorphic SNPs (N=246) are positioned on the map (tagging SNPs in pink). At bottom is a pairwise LD matrix for 141 controls across the subset of 220 SNPs with MAF ≥ 0.05. Red, D' = 1 (lod ≥ 2); blue, D' = 1 (lod < 2); pink, D' < 1 (lod ≥ 2); white, D' < 1 (lod < 2). Blocks of LD are denoted A, B, C and D. Block A contains all four candidate gene regions.

