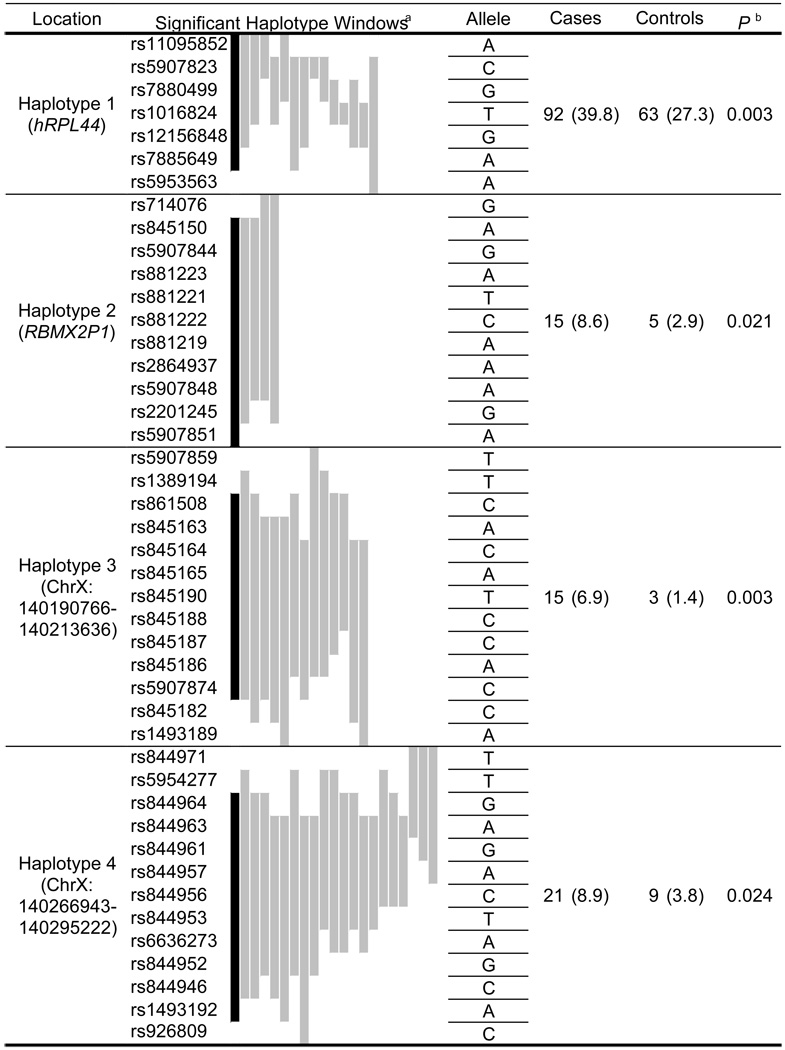
Table 2.
Sliding window risk haplotypes at Xq27 - Training subjects
 |
Sliding haplotype windows of P ≤ 0.05, graphically ordered as most (black) to least significant (left to right).
P for haplotype designated in black, with corresponding numbers of cases and controls, and haplotype frequencies (%).
