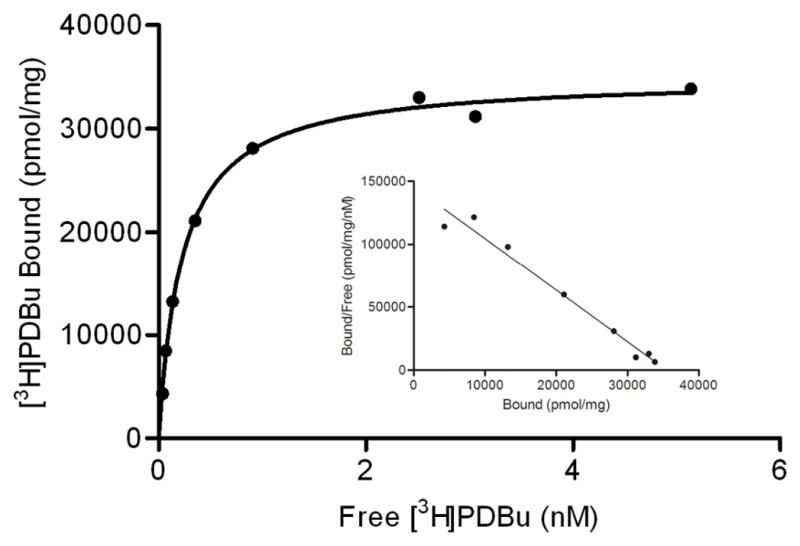
Figure 3.

Representative saturation curves with increasing concentrations of [3H]PDBu. [3H]PDBu scatchard plots for the synthetic δC1b domain are shown in the panel. Binding was measured using the polyethylene glycol precipitation assay. Each point represents the mean of triplicate determinations, generally with a standard error of 2%. Similar results were obtained in two additional experiments.
