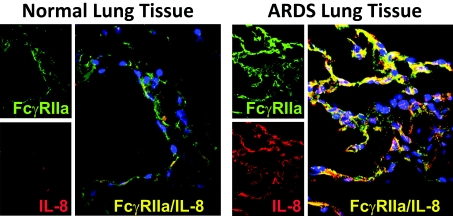
Figure 3. Expression of FcγRIIa and association of IL-8 in anti-IL-8 autoantibody/IL-8 immune complexes with FcγRIIa in normal lung tissues and tissues from ARDS patients.
Left panels from the top: FcγRIIa (green)/IL-8 (red) x60. Big left panel: co-localization (yellow) of FcγRIIa (green) and IL-8 (red). Nuclei are stained blue. Right panels from the top: FcγRIIa (green)/IL-8 (red) ×60. Big right panel: co-localization (yellow) of FcγRIIa (green) and IL-8 (red). Nuclei are stained blue. Acquisition settings for the images were UV/567/647, and specific parameters for the fluorophores were Cy3 (red) excitation at 567 nm and emission at 600 nm, Alexa 647 (pseudo-colour green) excitation at 647 nm and emission at 700 nm. The sections were evaluated using a PerkinElmer Ultra VIEW LCI confocal imaging system with a Nikon TE2000-S fluorescence microscope and a PlanApo'60 immersion oil objective. Ultra VIEW Imaging Suite software (version 5.5.0.4) was used for image processing.

