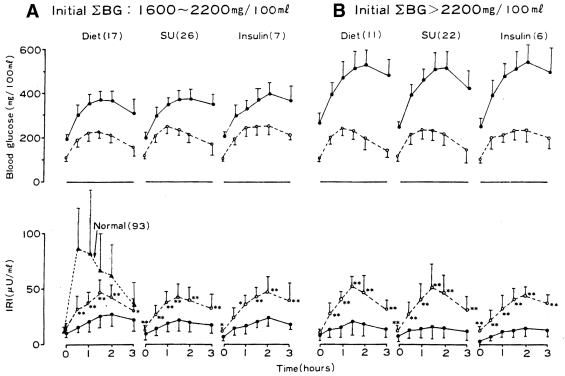
Figure 2.
Changes in blood glucose (BG) and plasma insulin (immunoreactive insulin [IRI]) during a 100-g glucose tolerance test before and after treatment with diet only, sulfonylurea (SU), or insulin of overtly diabetic patients (mean ± SD) according to the initial sum of blood glucose. Number in parentheses indicates number of patients before treatment (●) and after treatment (○). Reproduced with permission from Kosaka et al. (21).

