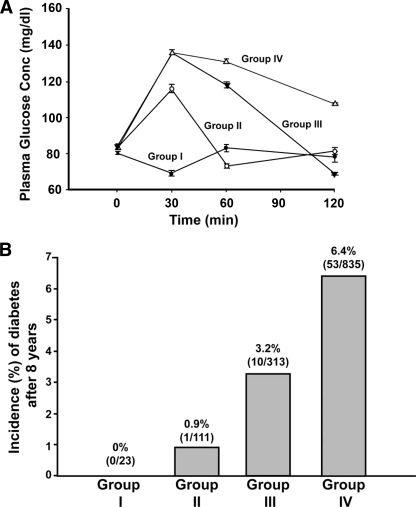
Figure 2.
Plasma glucose concentration during the OGTT in NGT subjects. Subjects were divided into four groups (A) based on the time it takes to return their plasma glucose concentration below the fasting level. B: The 8-year conversion rate to type 2 diabetes in the four groups of subjects. See text for more details.

