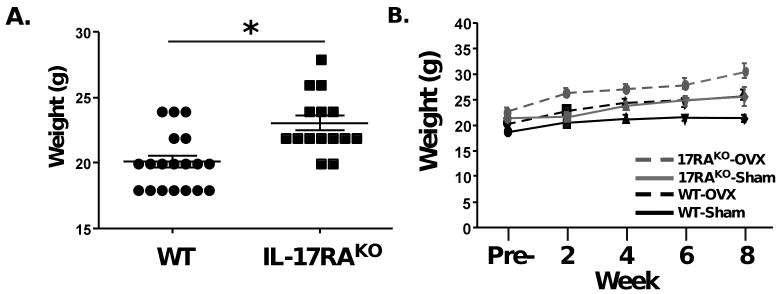
Figure 2. IL-17RAKO mice show increased weight compared to WT mice.
A. Weight (g) of WT and IL-17RAKO mice taken pre-OVX (includes mice from both Sham and OVX groups). *p<0.001 students t-Test. B. Average weight (g) of each group before OVX (“Pre”) and at 2-week intervals. Data are taken from the mice depicted in Figure 1.

