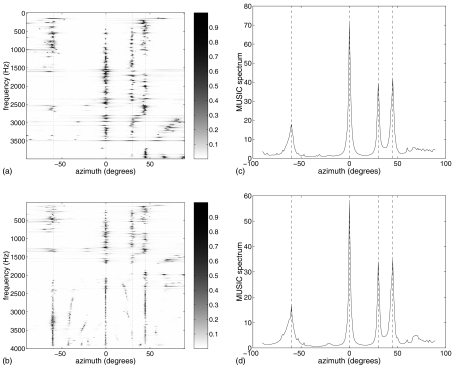
Figure 4.
MUSIC spectra from 4 s of four simultaneous speech sources using the measured responses of the OOb array on the KEMAR head. Dashed lines show the sources’ true DOAs (−60°, 0°, 30°, and 45°). (a) and (b) MUSIC spectra as a function of frequency and azimuth using variants 1 and 2 and (c) and (d) final MUSIC spectra using variants 1 and 2.

