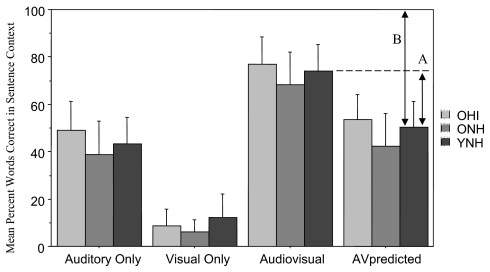
Figure 4.
Mean percent content words correct in the A, V, and AV testing the three groups. Error bars indicate standard deviation. Lines labeled A and B are aids in the conceptualization of the auditory enhancement measure for the young adults. Line A is the amount of performance beyond the AV predicted score that was actually obtained. Line B represents the amount that could have been improved, and is used for normalizing scores to determine the amount benefit afforded by having an integration process or mechanism.

