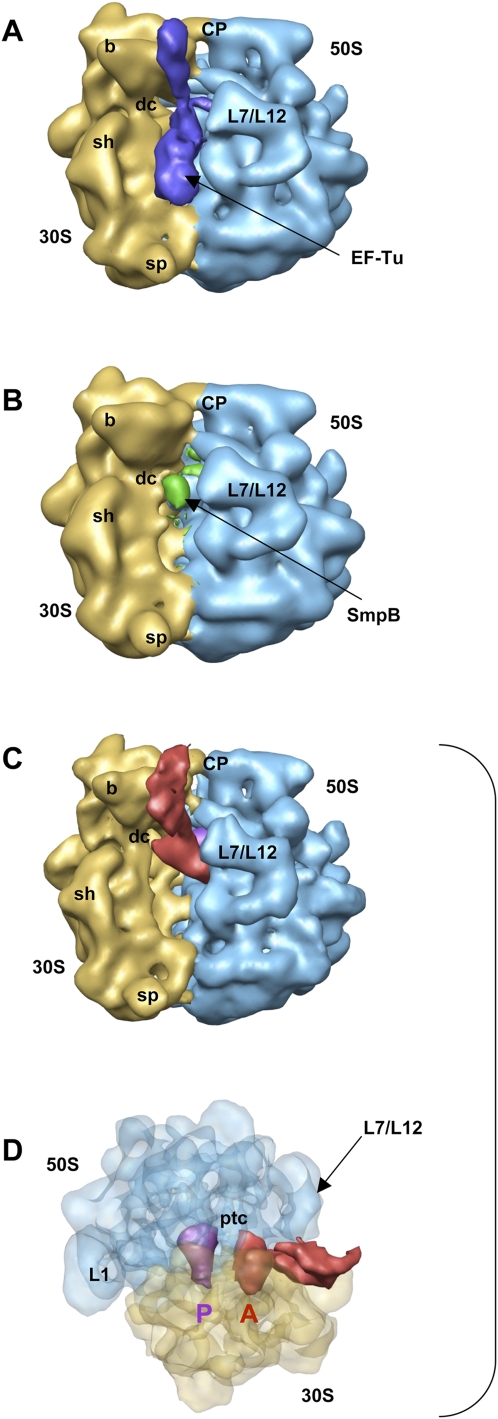
FIGURE 2.
Reconstruction of PKF–SmpB complex bound to the stalled ribosome. (A) Cryo-EM map generated from the first subset sorted by the local MSA method, corresponding to a preaccommodated state before the release of EF-Tu. (Blue) Density for EF-Tu–PKF–SmpB. (B) Cryo-EM map generated from the second subset and corresponding to a stalled ribosome in the absence of PKF with a molecule of SmpB nested into the decoding site of the small ribosomal subunit. (Green) Density for SmpB. (C) Cryo-EM map generated from the third subset and corresponding to the accommodated state after the release of EF-Tu·GDP (same orientation as in A). (Red) Density for PKF-SmpB; (purple) the P-site tRNA. B adopts the same orientation as in A, while C allows a better view of the positioning of PKF compared to the tRNA stuck in the P-site. (D) View of map shown in B after a rotation by +90° around the vertical axis and −90° around the horizontal axis. The density corresponding to the ribosome is semitransparent. (Blue) The 50S subunit; (yellow) the 30S subunit. Landmarks on the 50S subunit are as follows: CP, central protuberance; L7/L12, stalk formed by proteins L7/L12; ptc, peptidyl transfer center; L1, protein L1. Landmarks on 30S subunit are: b, beak; dc, decoding center; sh, shoulder; sp, spur.

