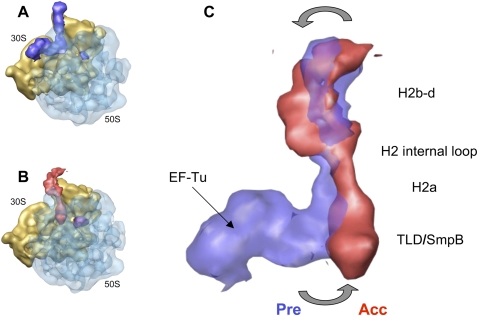
FIGURE 4.
Movements of PKF during accommodation. (A) Cryo-EM map of the preaccommodated state. (B) Accommodated state. For clarity, density for the 50S subunit is shown as semitransparent. (C) Superimposition of the PKF complex before (semitransparent blue) and after (red) accommodation. The orientation is the same as in A and B.

