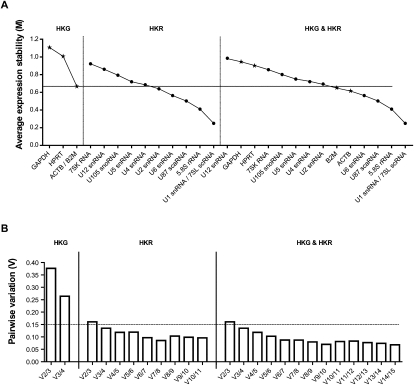
FIGURE 3.
Gene expression stability analysis of most stable housekeeping genes (HKGs) and housekeeping RNAs (HKRs) using geNORM. (A) Average expression stability values (M) of 15 most stable reference candidates after stepwise exclusion of the least stable reference candidate. M-values are represented for separate analysis of four HKGs (left, A) and 11 HKRs (center, B), as well as together (right, C). The horizontal line represents the lowest expression stability value for the most stable HKG (0.66). HKGs are represented as stars, HKRs are represented as circles. (B) Pairwise variation analysis showing optimal number of reference candidates for normalization for HKGs and HKRs, separately and together (from left to right, respectively). Pairwise variation value beneath 0.15 (horizontal line) with the least number of reference candidates used is considered as optimal.

