
Figure 1.
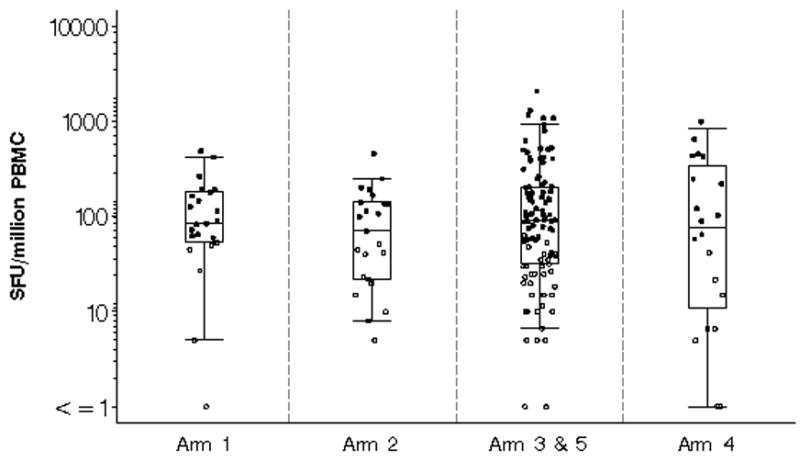
The maximum magnitude of T cell responses measured by interferon-γ ELISpot expressed as spot forming units (SFU) per one million peripheral blood mononuclear cells (PBMC) in vaccinees to either Env, Pol or Gag by immunization regimen 6 weeks after immunization. Open circles represent positive responses and black circles represent negative responses. A positive response was defined as at least 55 spot forming cells/106PBMC in peptide pools and 4 X background number of spot forming cells/106PBMC (media only). The box plots indicate the median, 25th and 75th percentile for each group and the error bars show the 5th and 95th percentiles. Placebo and baseline responses are not shown.