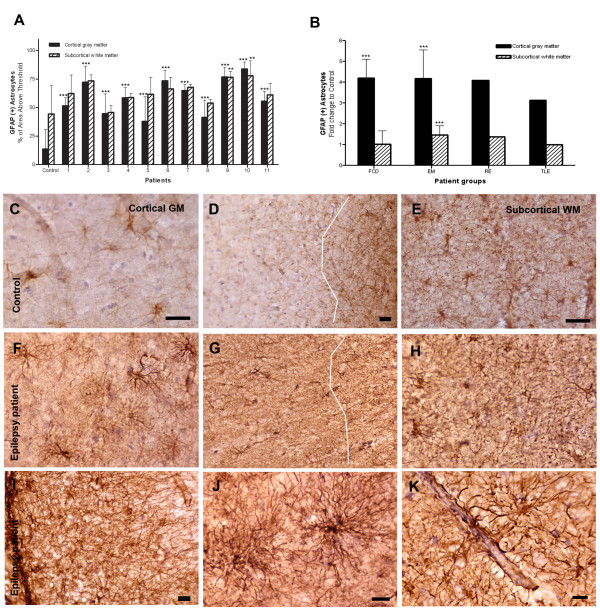
Figure 2.
Quantification of GFAP immunoreactive astrocytes in the cortex and white matter. (A) GFAP-immunoreactivity in individual patients (patients No. 1 to 11) and controls (n = 5). (B) Fold changes in the GFAP-immunoreactivity in epilepsy subgroups compared to controls. (C, D & E) Control: cortex, gray-white junction and white matter. (F, G & H) Epilepsy case: cortex, gray-white junction and white matter. Notice loss of clear gray-white demarcation in epilepsy case (G) compared to control (D). (I-K) High magnification of an epilepsy case. (I) Expanded subpial gliosis. (J) Cortical astrocytes with numerous thin and elongated processes, morphologically resembling fibrillary astrocytes. (K) Astrocytic end feet adhering to the wall of blood vessel. Bars: C-H = 100 μm; I-K = 20 μm. * p < 0.05, ** p < 0.01, *** p < 0.001 by one-way ANOVA.

