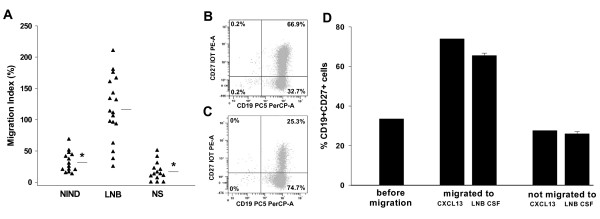
Figure 1.
Migration of B cells to CSF samples. (A) migration index of CD19+ B cells to CSF samples from different patient groups, horizontal bars represent the mean value, *: p < 0.001. (B) and (C) exemplary result of a FACS analysis of (B) migrated or (C) not-migrated CD19+CD27+ B cells towards the CSF sample of a LNB patient. (D) percentage of migrated vs. not-migrated CD27+CD19+ B cells, using either CSF-samples of patients with LNB (n = 3) or 500 ng/ml rhCXCL13 (mean of two independent experiments, done in duplicate) as chemotactic agents.

