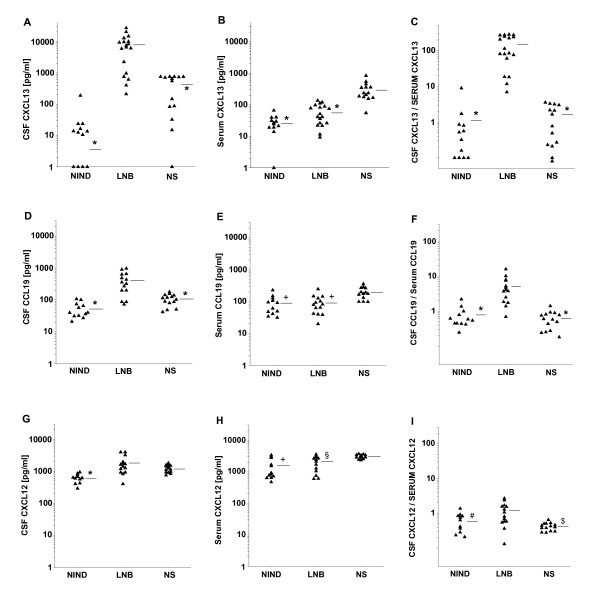
Figure 2.
Concentration of Chemokines in CSF samples. Concentration of the respective chemokines in either CSF- (A, D, and G) or serum-samples (B, E, and H) of the different patient groups, and accordingly the calculated CSF-to-serum ratio (C, F, and I), horizontal bars represent the mean value, *: p < 0.001, $: p = 0.003, and #: p = 0.021 vs. LNB, and +: p < 0.001, and § p = 0.013 vs. NS

