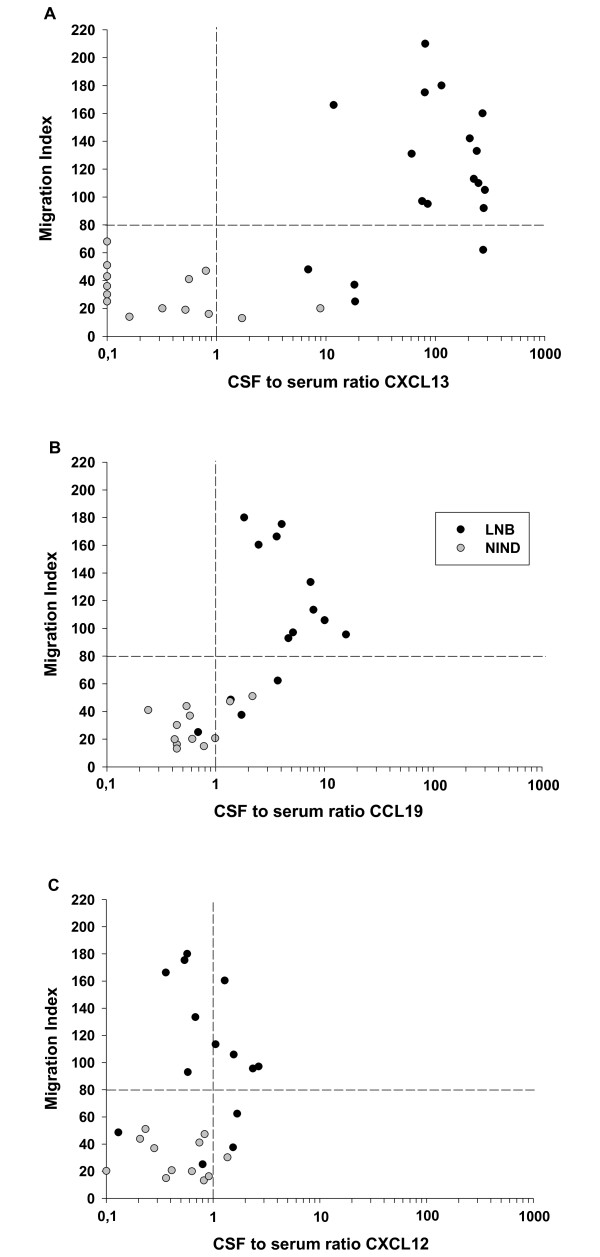
Figure 3.
Correlation of the CSF-to-serum ratio of chemokines with the migration index. Correlation of the CSR of the different chemokines with the MI of the respective CSF sample as measured in the migration assay. A cut-off for the MI was set at 80, as all CSF samples from NIND patients (and accordingly no inflammatory cell infiltrate in the CSF) had a MI below this value (horizontal dotted line). The vertical dotted line separates the samples with a "negative" CSR (<1) from those with a "positive" CSR (>1). A high proportion of CSF samples in the upper right or lower left quadrant indicate a positive association.

