Figure 3.
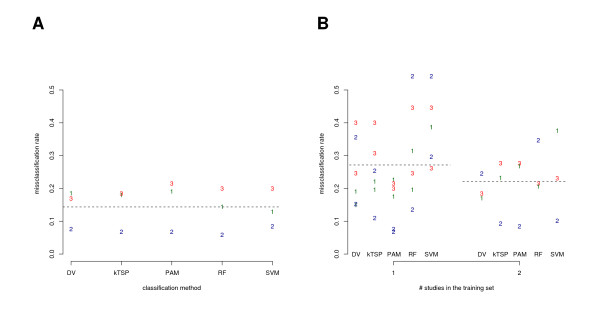
The misclassification error for each of the five classification methods and each of the studies (N = 3) is shown for histological grade. The plotted numbers in distinct colors indicate the study as listed in Table 1 while pointing to the corresponding misclassification rate. A: The misclassification rate was estimated with complete cross-validation in each study separately. B: The misclassification rate is shown for each training set combination subgrouped by the number of studies used in the training (see Figure 1). Dotted lines indicate averages across classification methods.

