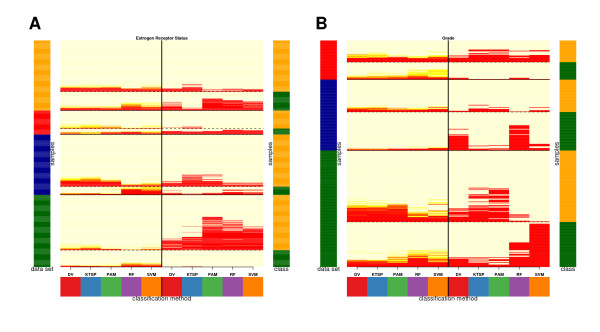
Figure 4.
The figure summarizes the main classification results while detailing class, data set and sample specific prediction performance (A: estrogen receptor status in four studies; B: histological grade in three studies). Samples correspond to rows and methods to columns. The estimates of the cross-validation approach are shown on the left separated by a vertical line from the results of the classification across studies on the right where the number of training sets was maximal (A:3, B:2). The graphical representation is similar to a heatmap. The area corresponding to a misclassified sample is labelled in red and in light yellow for a correctly classified sample. The error estimates of the repeated cross-validation have been mapped to the range from red to light yellow for each individual sample. The cross-validation approach was run separately for each study. For the classification across studies the results are shown in which all studies except the one used for assessment formed the training set (see Additional File 3 and 4 for the results of all training set combinations). Samples are ordered by study, class, their average misclassification rate in the cross-validation and classification across studies. The color code at the left indicates the study (green = 1, blue = 2, red = 3, orange = 4), at the right the class (A: green = ER-, orange = ER+; B: green = G1, orange = G3).

