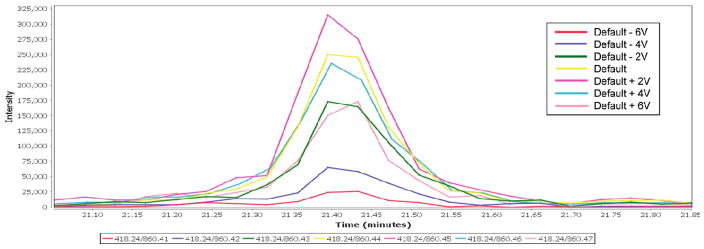
Figure 1.
Elution peaks (plotted as intensity vs elution time) for the transition 418.2 → 860.4 acquired at seven different collision energies. The second decimal place of the product m/z values listed in the figure codes for the collision energy used, with 860.41 corresponding to the lowest CE tested (default CE −6 V) and 860.47 corresponding to the highest CE tested (CE +6 V). For this particular transition, the plot clearly shows that the signal is maximal at 2 V higher than the default CE (magenta line) and decreases monotonically for both higher and lower CEs.

