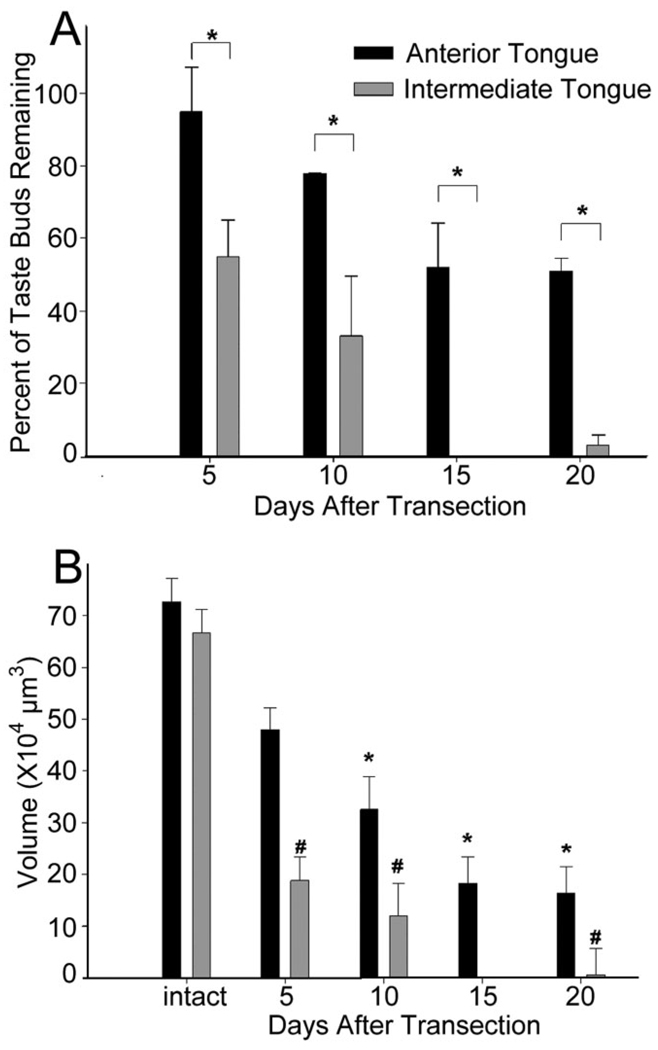
Fig. 3.
A: Percent of taste buds remaining after nerve transection: anterior vs. intermediate tongue. The intermediate tongue was particularly susceptible to taste bud loss. The anterior tongue lost as much as half its taste bud population after chorda-lingual transection. The intermediate tongue lost 100% and 97% of taste buds at 15 and 20 days, respectively. Asterisks (*) denote significant differences between anterior and intermediate regions at each time period posttransection. B: Total volume of taste buds (±SEM) on the anterior and intermediate tongue after transection. The intermediate tongue had significantly fewer taste buds, and in turn much less total taste tissue than the anterior tongue (P’s < 0.01). Asterisks (*) indicate significant differences from control volumes on the anterior tongue. The number symbol (#) represents significant differences between taste bud volumes on the intermediate tongue from control volumes.

