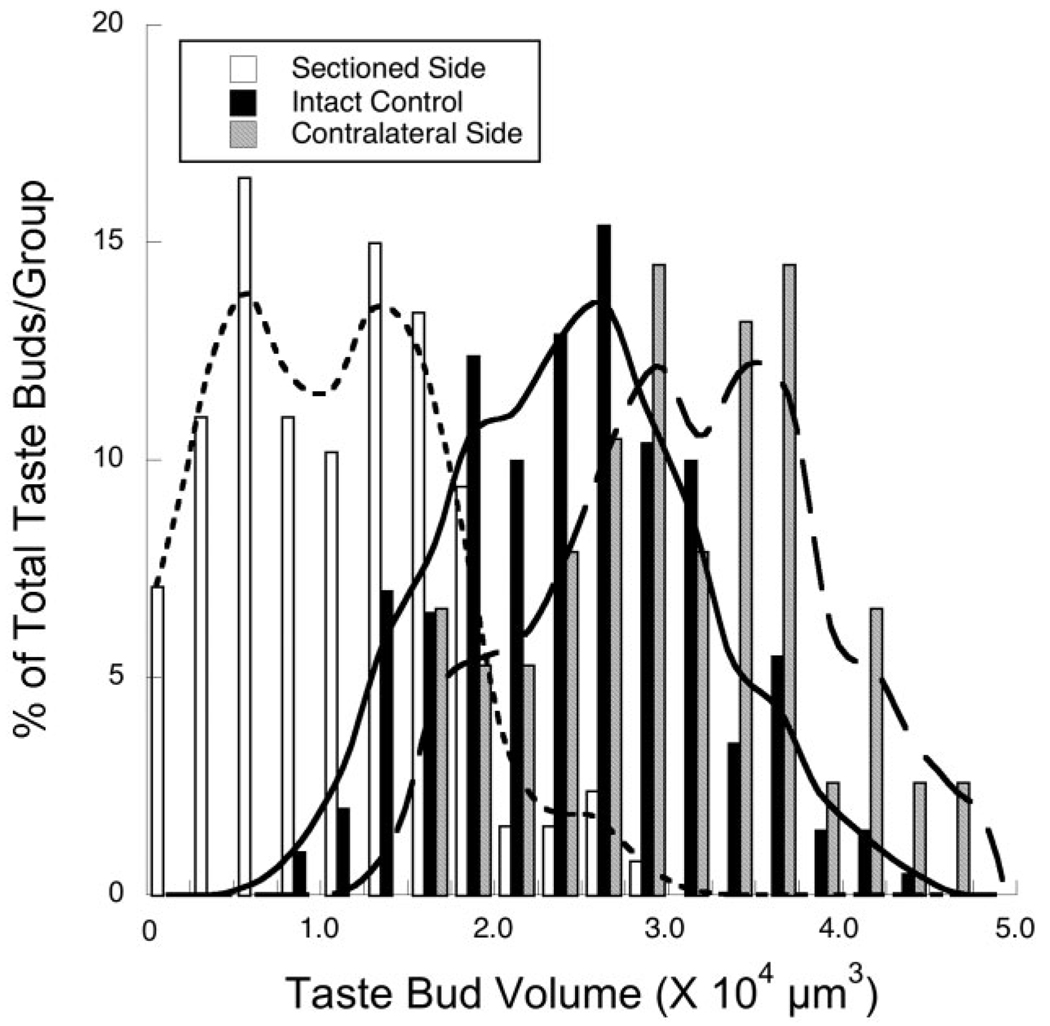
Fig. 4.
Frequency distributions (percent of the total number/group) of taste bud volumes from the side of the tongue ipsilateral to the nerve section (open bars; curve fit by dotted line), the intact control tongue (solid bars; curve fit by solid line), and the side contralateral to the nerve transection (gray bars; curve fit by dashed line).

