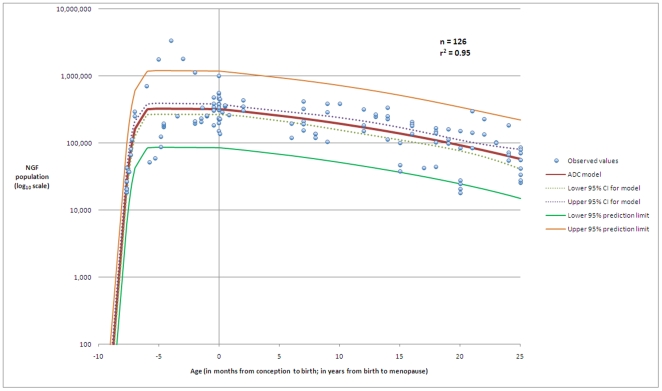
Figure 2. The model that best fits the histological data for ages up to 25 years.
The best model for the establishment of the NGF population after conception, and the subsequent decline until 25 years of age is described by an ADC model with parameters  = 5.79 (95% CI 5.03–6.55),
  = 28.0 (95% CI 15.8–40.2),
  = 57.4 (95% CI 33.1–81.8),
  = 0.074 (95% CI 0.067–0.081), and
  = 34.3 (95% CI −4.2–72.8). This model has correlation coefficient
  = 0.95, fit standard error = 0.29 and F-value = 585. This figure shows the dataset (n = 126), the model, the 95% prediction limits of the model, and the 95% confidence interval for the model. The horizontal axis denotes age in months up to birth at age zero, and age in years from birth to 25 years.

