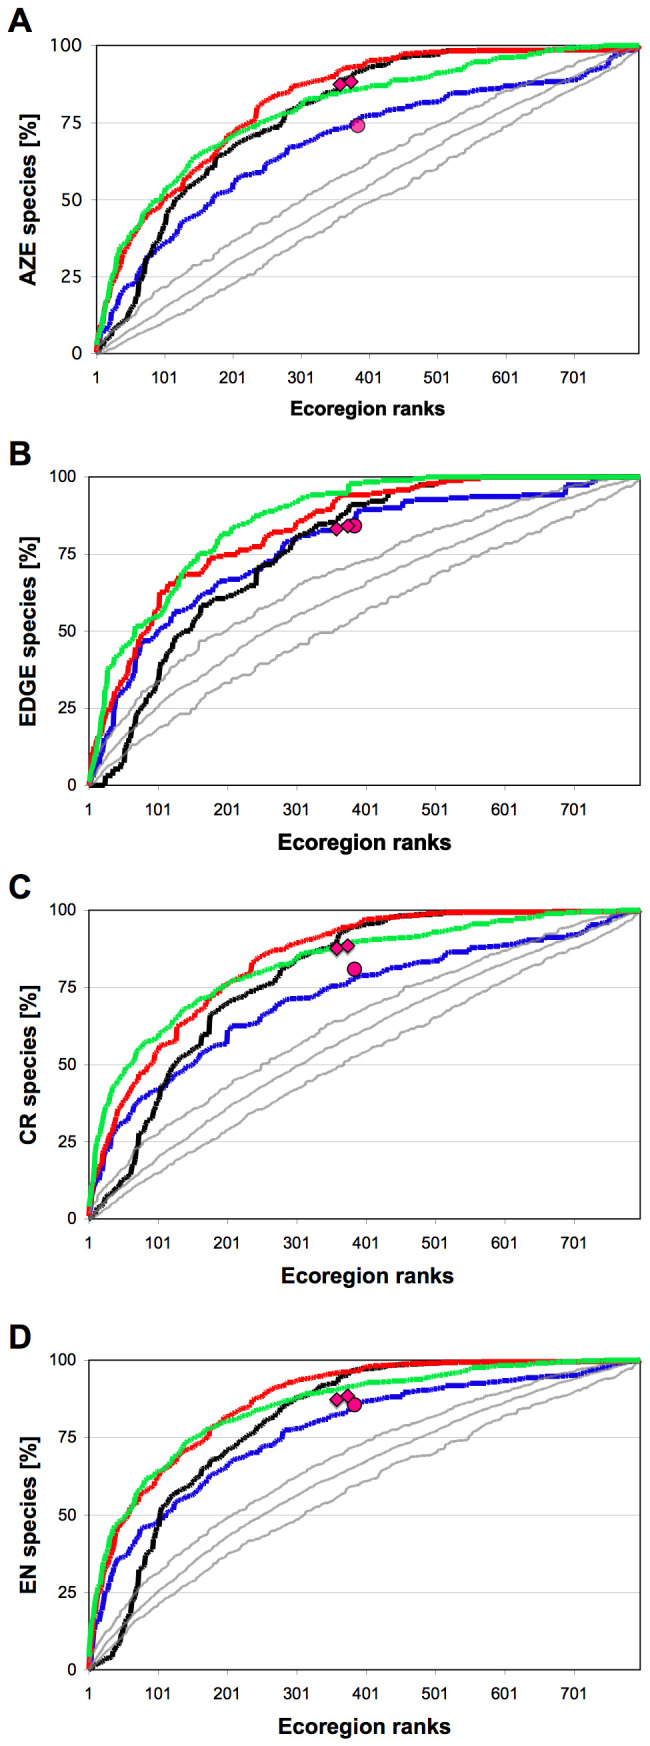
Figure 1. Accumulation of species over prioritized ecoregion ranks.

Target species are EDGE (A), AZE (B), Red List's critically endangered CR (C) and Red List's endangered EN (D) species. Lines represent accumulations of species when incrementally increasing the number of included ecoregions, which were continuously prioritized by species richness (blue), endemism (red), ∂-endemism (black), and threat (Red List categories CR+EN; green). Grey lines denote mean, 5% and 95%confidence limits when ecoregions are randomly selected (10000 simulations). Symbols represent species in ecoregions selected by the Global200 (circles) and Conservation International's Hotspots (diamonds; larger x-values for ecoregions within or overlapping Hotspots; smaller x-values for ecoregions within Hotspots).
