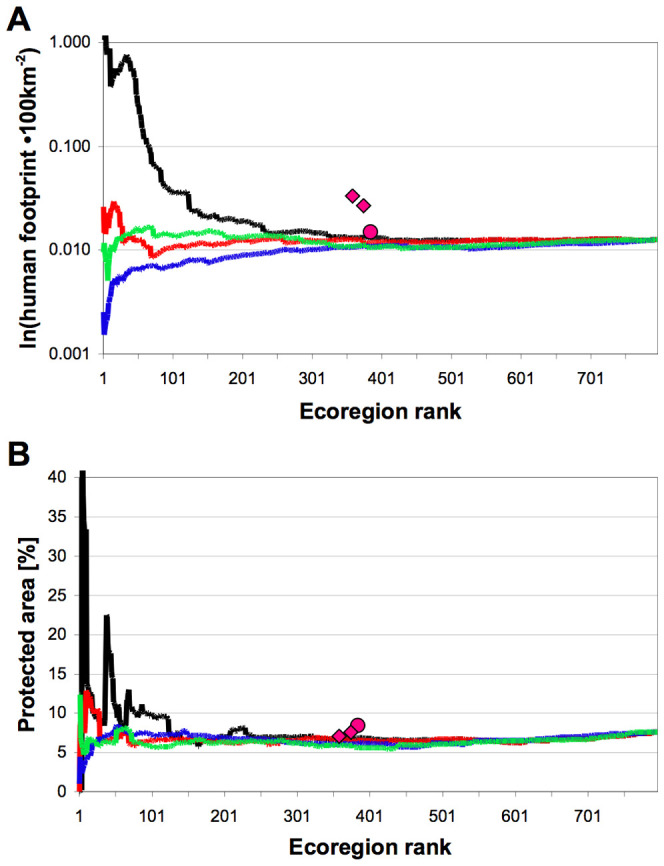
Figure 4. Average human footprint (A) and the percentage of protected area (B) over prioritized ecoregion rank.

Lines represent values when incrementally increasing the number of included ecoregions, which were continuously prioritized by species richness (blue), endemism (red), ∂-endemism (black), and threat (Red List categories CR+EN; green). Symbols represent ecoregions selected by the Global200 (circles) and Conservation International's Hotspots (diamonds; larger x-values for ecoregions within or overlapping Hotspots; smaller x-values for ecoregions within Hotspots). Human footprint data and protected area sizes are from the WWF databases. The human footprint refers to the average footprint index, ranging from 0 to 100, and is scaled here to 100 square kilometres.
